Case Study: NASA Mars Weather Station
Background
This is not a client project; rather it is a concrete example of a typical Rezenent project. This project gathers data from several resources before concatenating them into a dashboard for end user consumption. The explanation is below the following dashboard image.
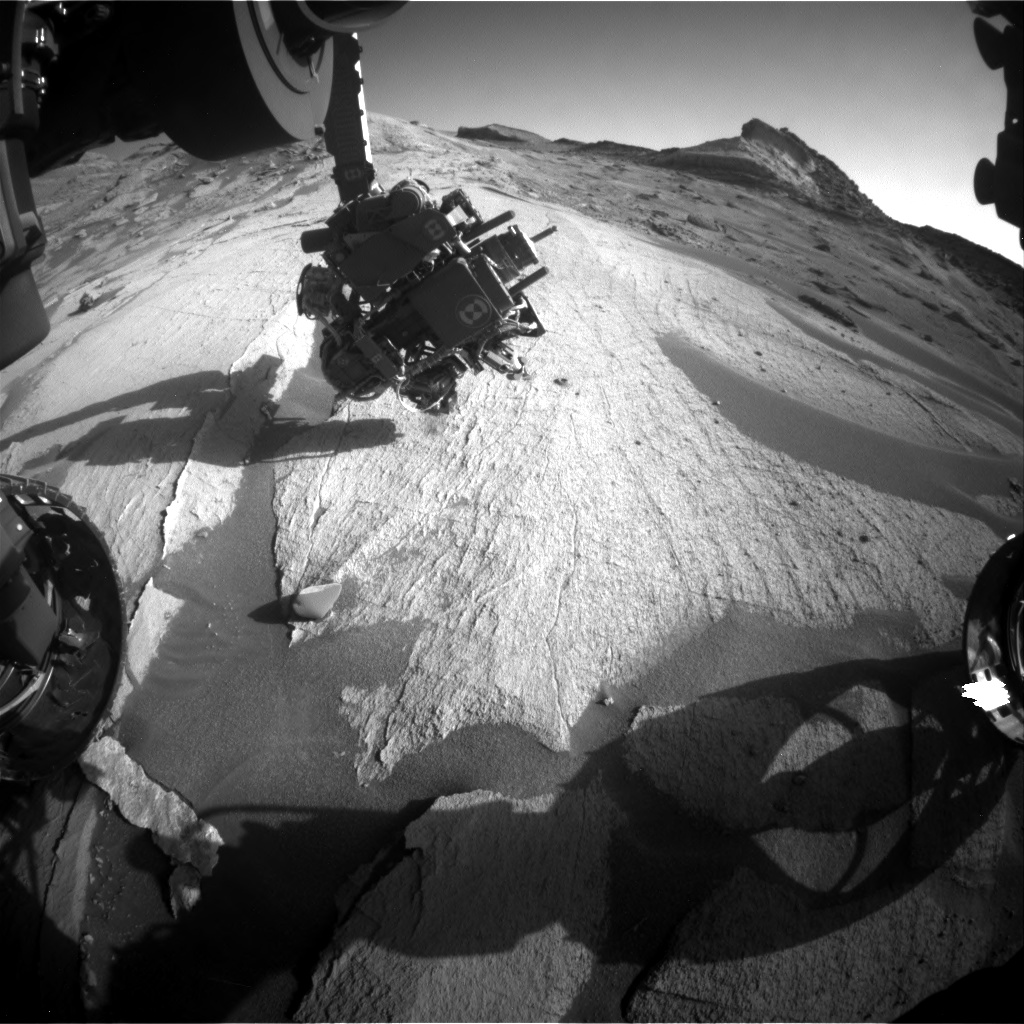
Snapshot: 2020-05-16T14:15:03Z UTC
Martian Season: Summer
Sol 516
May 10
High: 34° F
Low: -135° F
Sol 517
May 11
High: 34° F
Low: -134° F
Sol 518
May 12
High: 30° F
Low: -135° F
Sol 519
May 13
High: 31° F
Low: -134° F
Sol 520
May 14
High: 29° F
Low: -135° F
Sol 521
May 15
High: 29° F
Low: -135° F
Sol 522
May 16
High: 28° F
Low: -135° F
Preserved as a fixed snapshot of the pipeline's output — this instance hasn't run nightly since 2020, so the dates below are historical rather than live.
Explanation
Data Sources
Mars Rover Photos
(Summary |
API)
Image data gathered by NASA's Curiosity, Opportunity, and/or Spirit rovers on Mars
InSight: Mars Weather Service API
(Summary |
API)
Mars Weather Service API
Storage
Amazon Simple Storage Service, or S3
(Service)
Store and retrieve any amount of data, at any time, from anywhere on the web
Process
While this pipeline was running, it worked like this:
- Each night, a script ran against the Mars Rover Photo NASA API to find the latest Forward Hazard Avoidance (FHAZ) photo available from the Curiosity Rover on Mars, downloaded the image, and then uploaded the image to S3 for storage.
- The script then ran against the Insight: Mars Weather Service API from NASA to download the last seven days of weather data for Mars.
- The script finally regenerated this webpage with the updated image and weather data.
Rezenent
This is a great example of some of the work that Rezenent performs, i.e. take 2 or more data sources, store in an intermediate location, change the data representation for the client's needs, and then routinely update a dashboard or other interface to inform decision makers.
This is commonly known as Extract, Transform, and Load - or ETL - in the data management field. Rezenent goes a step further by providing a client facing frontend for customer consumption.
Please reach out to us if you have this same business need. We would love to learn more about your business and find a way for Rezenent to help you define, collect, analyze, and make better business decisions.